文件大小:76.5 MB
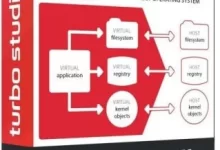
强大的行级采样分析器可精确定位应用内部的性能瓶颈。与传统的.NET分析器不同,我们的软件允许用户分析包含本地源代码的进程。因此可识别本地源代码引发的性能问题(例如来自.NET运行时等第三方库)。
该工具还支持事件追踪以优化用户体验,可捕获文件I/O活动、网络活动和调试事件,从而将关键应用指标与时间轴关联。通过添加数据上下文信息,可深入源代码层面之外调查应用内部状态。内置时间轴功能支持用户处理特定时间范围数据。
.NET性能分析器
解决内存与资源泄漏
集成式.NET内存分析器能帮助用户定位内存问题和资源泄漏的根本原因。该分析器运行快速,内存占用和执行时间开销极低,且分配堆栈记录速度优异。
本工具以下列卓越功能超越传统.NET内存分析器:
内存概览(托管堆、Win32堆、模块、映射文件、堆栈等)提供全局视角;
追踪包括.NET运行时在内的本地源代码引发的内存与资源问题;
捕获任意第三方源代码的Win32分配,以诊断本地源代码内存泄漏;
GDI资源追踪:通过资源配置文件信息识别资源泄漏(位图、字体、画刷、设备上下文等),利用资源分配触发堆栈修复泄漏;
追踪文件映射事件——单个进程可能占用数GB内存,导致应用性能迟滞,而传统分析器对此类问题束手无策;

File size: 76.5 MB
The powerful line level sampling profiler provides functionality to pinpoint performance bottlenecks within the app. In contrast to a classic .NET profiler, our software allows the user to analyze processes with native code. Thus, performance issues triggered by native code can be identified, for instance from 3rd party libraries like the .NET runtime.
In addition, the tool supports event tracing to maximize the user experience. File I/O activity, network activity and debug events can be captured. That way interesting app insights can be correlated with the timeline. Data context information can be added to investigate internals of apps beyond code level. The built-in timeline functionality empowers the user to process interesting time ranges.
.NET Performance Profiler
Resolve Memory & Resource Leaks
The integrated .NET memory profiler empowers the user to identify the root causes for memory issues and resource leaks. The memory profiler is fast with minimal overhead in regards to memory consumption and execution times. Allocation stack recording is quite fast.
Our tool trumps classic .NET memory profilers with outstanding features
Memory overview (Managed Heap, Win32 Heap, Modules, Mapped Files, Stacks, etc) to get the big picture.
Tracking of memory and resource issues triggered from native code including the .NET runtime.
Capture of Win32 allocations from any 3rd party code to investigate memory leaks from native code.
GDI Resource Tracking: Use the resource profiling information to identity resource leaks (bitmaps, fonts, brushes, DCs etc). Fix the found leaks with the help of resource allocation trigger stacks.
Tracking of file mapping events which can contribute multiple gigabytes of memory usage for a single process. As a result your app will experience sluggish performance. Here, a classic profiler will not give you any clue why your app runs into issues.
Analysis of crash (memory) dump files.